FusionCharts
JavaScript charts for web & mobile. The most comprehensive JavaScript charting library, with over 90 charts and 900 maps. Loved by 23,000 customers in 120 countries.
More Infomation : www.fusioncharts
Build beautiful web & mobile dashboards
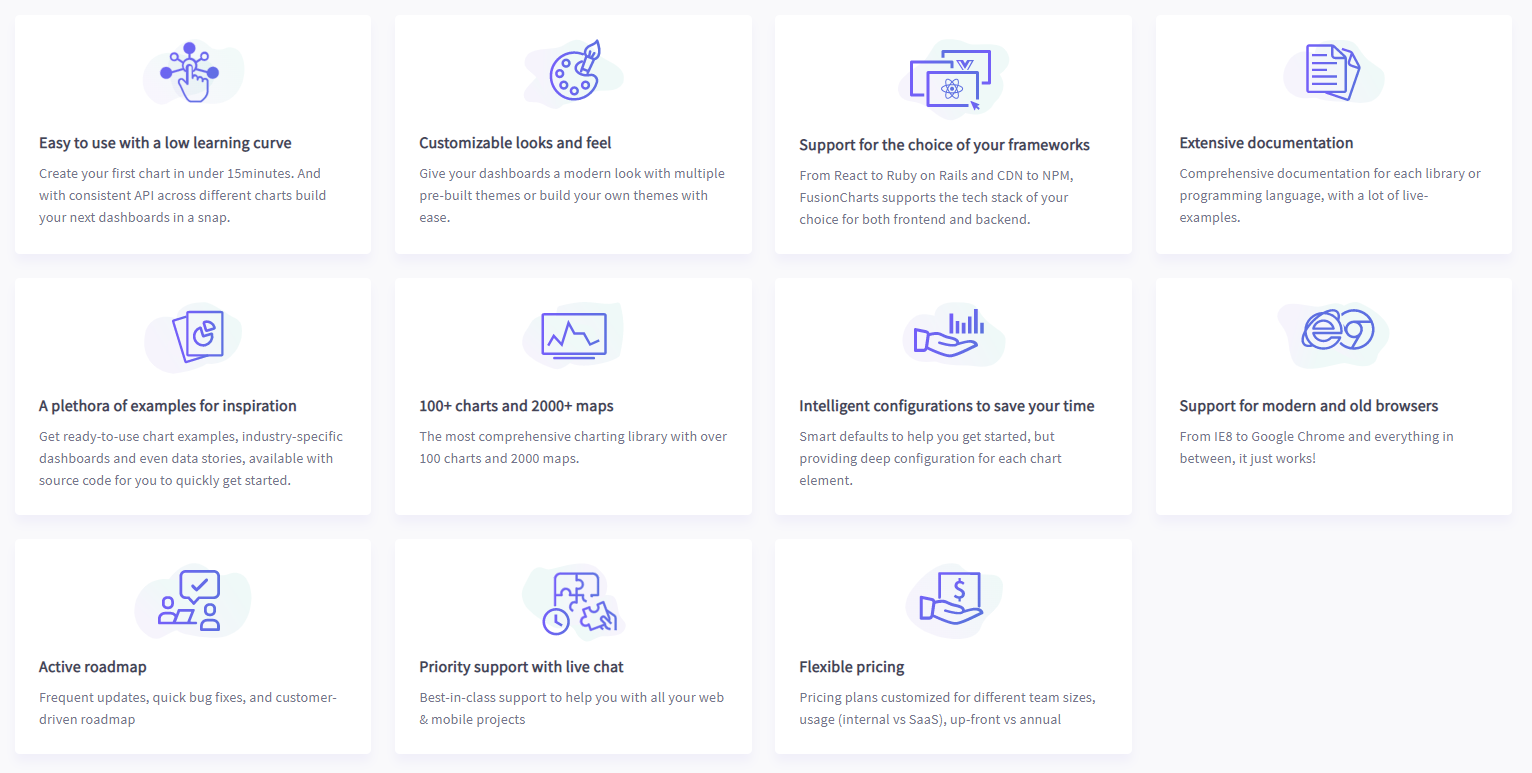
With our interactive and responsive charts, extensive documentation, consistent API, and cross-browser support - your next great dashboard starts here!

FusionCharts Suite
Beautiful charts and maps for your dashboards
Get over 100+ charts, graphs and gauges along with 2000+ choropleth maps and take your dashboard to a whole new level
Beautiful charts and maps for your dashboards
Get over 100+ charts, graphs and gauges along with 2000+ choropleth maps and take your dashboard to a whole new level
FusionTime
Powerful time-series and stock charts for you
From IoT to stock market, render thousands of data points in modern browsers, without a glitch for your next-generation dashboards
Powerful time-series and stock charts for you
From IoT to stock market, render thousands of data points in modern browsers, without a glitch for your next-generation dashboards
FusionExport
Export your entire dashboards, not just charts
Allow users to export entire dashboards as PDF, or send a live copy of the dashboard to their emails
Export your entire dashboards, not just charts
Allow users to export entire dashboards as PDF, or send a live copy of the dashboard to their emails
100+ Interactive Charts & 2,000+ Data-driven Maps
Get all the variations of popular charts like Bar, Column, Line, Area, and Pie; or domain-specific charts like Treemaps, Heatmaps, Gantt Charts, Marimekko Charts, Gauges, Spider Charts, Waterfall Charts, and many more! In addition to charts, we also have over 2000+ choropleth maps which cover countries, counties and even cities!